
- SAP Community
- Products and Technology
- Enterprise Resource Planning
- ERP Blogs by Members
- How to capture queries, tables and fields using th...
Enterprise Resource Planning Blogs by Members
Gain new perspectives and knowledge about enterprise resource planning in blog posts from community members. Share your own comments and ERP insights today!
Turn on suggestions
Auto-suggest helps you quickly narrow down your search results by suggesting possible matches as you type.
Showing results for
Former Member
Options
- Subscribe to RSS Feed
- Mark as New
- Mark as Read
- Bookmark
- Subscribe
- Printer Friendly Page
- Report Inappropriate Content
07-09-2013
4:43 PM
SQL Server Profiler Step by Step
Introduction
Microsoft SQL Server Profiler is a graphical user interface to SQL Trace for monitoring T-SQL Statements of Database Engine. We can save and reuse the state at a later point of time.
- We can do the following using SQL Server Profiler
- Create a trace
- Watch the trace results as the trace runs
- Store the trace results in a table
- Start, stop, pause, and modify the trace results as necessary
- Replay the trace results
- Use SQL Server Profiler to monitor only the events in which you are interested.
Menu Path: Start | All Programs | Microsoft SQL Server 2005 | Performance Tools | SQL Server Profiler.
The following screen will come:
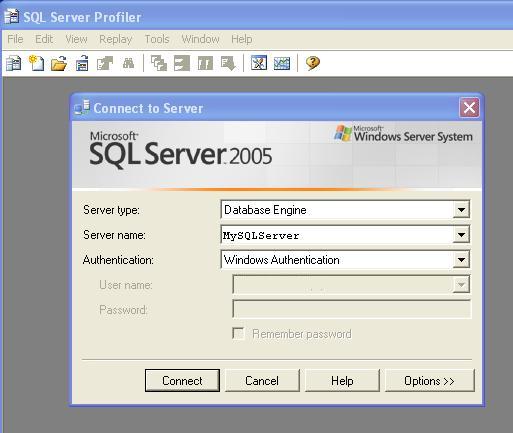
Figure 1.0
Click on <Connect> Button. New Properties Screen will come:
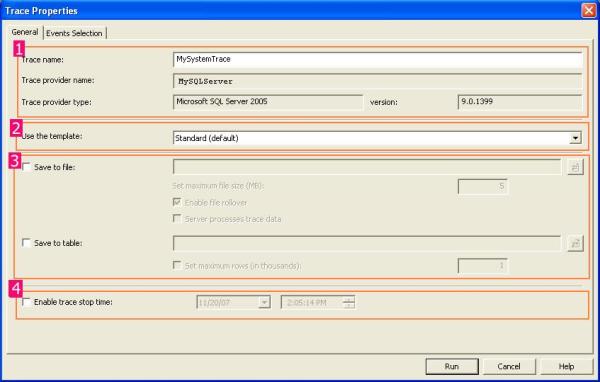
Figure 1.1
It has two selection tabs:
- General: It is used for general setting for Trace Database Engine.
- Event: It is used to add or remove some selected event for monitor.
In General Section (as given in Figure 1.1), it is divided into four sections.
Section 1: In this section, you have to just specify the name of your trace, Trace provider name and server name are predefined and based upon your SQL Server.
And it is not editable.
Section 2: It is the template section. You can choose different type of Templates based upon your requirements. It is the configuration for trace. By default, it is "Standard (Default)" templates. Others templates are T-SQL, T-SQL Duration, T-SQL Reply, T-SQL SPs, etc. You can create your own custom Templates by selecting different Events and Event Class. It is saved as ".tdf" Extension.
Section 3: This section is related to save your trace. Either as File (.trc) or in a database. as table. While clicking on Save to file check box, File save dialog box should open and you can save that file (with .trc extension).
If you check the "Save to Table", it will connect with your server and ask you to which database you want to save that trace table information.
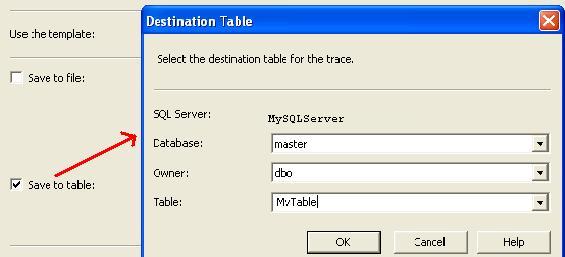
Figure 1.2
Section 4: You can stop your trace on a particular time. Check the "Enable trace stop time" checkbox and give the time at which you want to stop track, SQL Server will automatically stop trace on that time.
Now Move To "Event Section" Tab.
Now we need to know some definition with respect to SQL Server Profiler.
What is an Event?
An Event is an action or operation that is performed in your SQL Server 2005 Database Engine.
Some examples of Events are:
- Transact-SQL SELECT, INSERT, UPDATE, and DELETE statements.
- User login and logout
- Execution of Stored procedures
- Operation with cursor
SQL Server profiler is able to trace all of these events and all these events are categories on a particular Event class.
What is an Event Class?
Event class is a type of event that can be traced.
Some examples are:
- SQL: BatchCompleted
- SQL: Batch Starting
- Audit Login
- Audit Logout
- Lock: Acquired
- Lock: Released
Now you can select events from this screen:
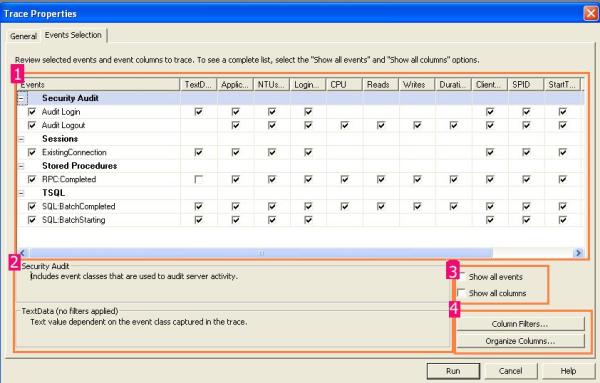
Figure 1.3
In section 1, we can select the proper check box based upon our requirement, section 2 will display the details of Selected events and Events class. If you check in the check box of section 3, you will get all the list of Events and Columns in Section 1.
Section 4 is something like customization. Just click on the "Column Filter Button". In this section, you can specify some condition (like or Not like).
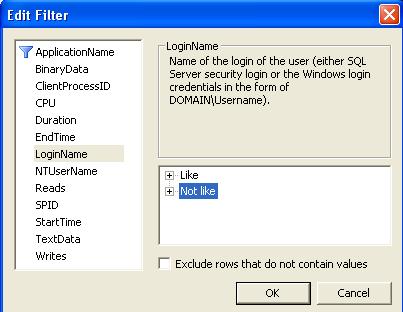
Figure 1.4
By clicking on "Organize Column" button, you can change the sequence of order of selected events.
Now Click on the "Run" Button, then Trace window will come:
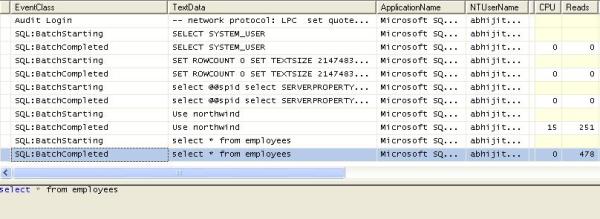
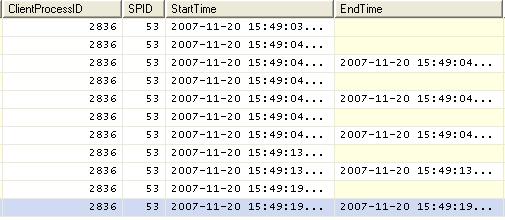
Figure 1.5
Using these windows, you will get the detailed time duration of a query and all other events information that you have selected.
You can save this result and use it in future. Or you can extract a particular query from the trace, just right click and click on "Extract Event Data". And save this as a SQL Script.
Reply in SQL Server Profiler
SQL Server profiler has a Reply facility which has the ability to save a trace and replay it later.
Replay is useful to troubleshoot an application. Trace replay supports debugging by using Toggle Breakpoint and the Run to Cursor options on the SQL Server Profiler Replay menu.
Anything changed in SQL Server Management Studio will be traced by the SQL Profiler. So it can basically be used for database performance check. We also have "SQL Server Performance Monitor" to monitor the System and Server performance too.
References:
http://www.codeproject.com/Articles/21371/SQL-Server-Profiler-Step-by-Step
http://msdn.microsoft.com/pt-br/library/cc580638.aspx
http://pedrogalvaojunior.wordpress.com/2009/09/18/profiler-para-sql-server-20052008-express/
http://blog.sqlauthority.com/2009/08/03/sql-server-introduction-to-sql-server-2008-profiler-2/
Regards,
Marcelo Silva Santos
- SAP Managed Tags:
- SAP Business One
1 Comment
You must be a registered user to add a comment. If you've already registered, sign in. Otherwise, register and sign in.
Labels in this area
-
"mm02"
1 -
A_PurchaseOrderItem additional fields
1 -
ABAP
1 -
ABAP Extensibility
1 -
ACCOSTRATE
1 -
ACDOCP
1 -
Adding your country in SPRO - Project Administration
1 -
Advance Return Management
1 -
AI and RPA in SAP Upgrades
1 -
Approval Workflows
1 -
ARM
1 -
ASN
1 -
Asset Management
1 -
Associations in CDS Views
1 -
auditlog
1 -
Authorization
1 -
Availability date
1 -
Azure Center for SAP Solutions
1 -
AzureSentinel
2 -
Bank
1 -
BAPI_SALESORDER_CREATEFROMDAT2
1 -
BRF+
1 -
BRFPLUS
1 -
Bundled Cloud Services
1 -
business participation
1 -
Business Processes
1 -
CAPM
1 -
Carbon
1 -
Cental Finance
1 -
CFIN
1 -
CFIN Document Splitting
1 -
Cloud ALM
1 -
Cloud Integration
1 -
condition contract management
1 -
Connection - The default connection string cannot be used.
1 -
Custom Table Creation
1 -
Customer Screen in Production Order
1 -
Data Quality Management
1 -
Date required
1 -
Decisions
1 -
desafios4hana
1 -
Developing with SAP Integration Suite
1 -
Direct Outbound Delivery
1 -
DMOVE2S4
1 -
EAM
1 -
EDI
2 -
EDI 850
1 -
EDI 856
1 -
edocument
1 -
EHS Product Structure
1 -
Emergency Access Management
1 -
Energy
1 -
EPC
1 -
Financial Operations
1 -
Find
1 -
FINSSKF
1 -
Fiori
1 -
Flexible Workflow
1 -
Gas
1 -
Gen AI enabled SAP Upgrades
1 -
General
1 -
generate_xlsx_file
1 -
Getting Started
1 -
HomogeneousDMO
1 -
IDOC
2 -
Integration
1 -
learning content
2 -
LogicApps
2 -
low touchproject
1 -
Maintenance
1 -
management
1 -
Material creation
1 -
Material Management
1 -
MD04
1 -
MD61
1 -
methodology
1 -
Microsoft
2 -
MicrosoftSentinel
2 -
Migration
1 -
MRP
1 -
MS Teams
2 -
MT940
1 -
Newcomer
1 -
Notifications
1 -
Oil
1 -
open connectors
1 -
Order Change Log
1 -
ORDERS
2 -
OSS Note 390635
1 -
outbound delivery
1 -
outsourcing
1 -
PCE
1 -
Permit to Work
1 -
PIR Consumption Mode
1 -
PIR's
1 -
PIRs
1 -
PIRs Consumption
1 -
PIRs Reduction
1 -
Plan Independent Requirement
1 -
Premium Plus
1 -
pricing
1 -
Primavera P6
1 -
Process Excellence
1 -
Process Management
1 -
Process Order Change Log
1 -
Process purchase requisitions
1 -
Product Information
1 -
Production Order Change Log
1 -
Purchase requisition
1 -
Purchasing Lead Time
1 -
Redwood for SAP Job execution Setup
1 -
RISE with SAP
1 -
RisewithSAP
1 -
Rizing
1 -
S4 Cost Center Planning
1 -
S4 HANA
1 -
S4HANA
3 -
Sales and Distribution
1 -
Sales Commission
1 -
sales order
1 -
SAP
2 -
SAP Best Practices
1 -
SAP Build
1 -
SAP Build apps
1 -
SAP Cloud ALM
1 -
SAP Data Quality Management
1 -
SAP Maintenance resource scheduling
2 -
SAP Note 390635
1 -
SAP S4HANA
2 -
SAP S4HANA Cloud private edition
1 -
SAP Upgrade Automation
1 -
SAP WCM
1 -
SAP Work Clearance Management
1 -
Schedule Agreement
1 -
SDM
1 -
security
2 -
Settlement Management
1 -
soar
2 -
SSIS
1 -
SU01
1 -
SUM2.0SP17
1 -
SUMDMO
1 -
Teams
2 -
User Administration
1 -
User Participation
1 -
Utilities
1 -
va01
1 -
vendor
1 -
vl01n
1 -
vl02n
1 -
WCM
1 -
X12 850
1 -
xlsx_file_abap
1 -
YTD|MTD|QTD in CDs views using Date Function
1
- « Previous
- Next »
Related Content
- Audit log in SAP application in Enterprise Resource Planning Q&A
- SAP Fiori for SAP S/4HANA – Upgrade Faster – Managing app lifecycle impacts on users in Enterprise Resource Planning Blogs by SAP
- Deletion of Custom Configurations (Customer Adaptation) in SAP S/4HANA Cloud, Public Edition in Enterprise Resource Planning Blogs by SAP
- Supply Chain Management in SAP S/4HANA Cloud, Private Edition 2023 in Enterprise Resource Planning Blogs by SAP
- Support for Reporting of Time Events in SAP SuccessFactors Time Tracking in Enterprise Resource Planning Blogs by SAP
Top kudoed authors
| User | Count |
|---|---|
| 2 | |
| 2 | |
| 2 | |
| 2 | |
| 2 | |
| 2 | |
| 2 | |
| 2 | |
| 1 | |
| 1 |