JMeter Plugins
In my recent article on executing a JMeter performance test with Web Intelligence I was unsuccessful in achieving the target average response time I set in my objective. In order to identify potential bottlenecks in the test configuration, it is imperative that we have access to server metrics such as CPU, Memory, and Disk I/O. These can be retrieved a number of ways, such as through Windows Performance Monitor, or a comprehensive monitoring suite such as HP OpenView or SAP Remote Support Component. Performance Monitor can be cumbersome to use in an environment with numerous physical machines, since you have to collect the metrics individually and review them in isolation from one another. On the other hand, enterprise monitoring systems require a lot of overhead to install and maintain (Think multi-week installs, consultants, and more infrastructure) and your organization simply may not have access to one.
Fortunately, the JMeter Plugins project provides us with the tools necessary to integrate critical performance data directly into our JMeter test plan. When used in conjunction with a JMeter Monitor Test Plan for retrieving statistics from the Java Application Server, we should be able to identify any resource related bottlenecks that exist in the system and take action accordingly.

We'll make one alteration to the configuration identified in the article in order to more clearly demonstrate the steps required to monitor application resource consumption from the JMeter interface. In this example, the SAP BusinessObjects Enterprise XI 3.1 configuration will be split across 3 physical machines:
1 server hosts the CMS and FRS (R3SP3)
1 server hosts Web Intelligence (R3SP3B)
1 server hosts Tomcat (R3SP3WEBA)
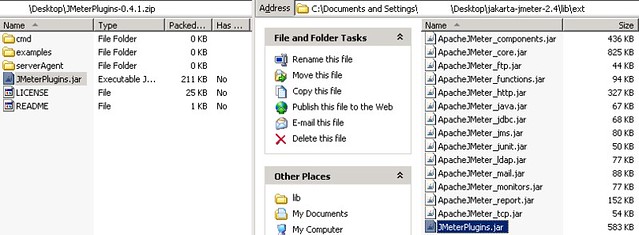
Deploy the JMeter Plugins
I've downloaded version 0.4.1 of the JMeter Plugins from Google Code. To extend JMeter functionality, it is a simple matter of extracting the JMeterPlugins.jar file from the archive into the /lib/ext directory of the JMeter installation.
We can add the Server Monitor component to any of our JMeter Test Plans by selecting the 'jp@gc - Servers Performance Monitoring' (JMeter Plugins @ Google Code) component from Listeners. For simplicity, I suggest adding a new Thread Group to store all of the performance monitors you might add. Since there is a limitation of one metric (CPU, Memory, etc) per listener, you will need to add an additional listener for each metric you with to capture.
You can configure the Thread Group with the default settings. The listener only captures data while any thread group is running, so it isn't necessary to configure it specifically.

Add a row for each machine you want to monitor and modify the default port if desired

Next, we extract the serverAgent directory to a directory (I've used the root of my C: drive for ease of access) on each of the XI 3.1 servers. The plugin runs on a number of operating systems, including Linux, Solaris, and AIX, but since I'm using Windows, I will outline the steps for that OS specifically. The only other prerequisite is that the plugins must have access to Java, so I'll add it to my system path. You can do this in the Windows GUI or via the command line and you can use the version of the JDK that ships with XI 3.1. Launch a Windows command prompt and run the following:
set PATH=%PATH%;C:Program FilesBusiness Objectsjavasdk in
You can confirm that this worked properly by running this command next:
java -version
If java is found, you should get some output like this:
C:Documents and SettingsAdministrator>java -version
java version "1.6.0_24"
Java(TM) SE Runtime Environment (build 1.6.0_24-b07)
Java HotSpot(TM) Client VM (build 19.1-b02, mixed mode, sharing)
That's it! We'll start the server agent on each of our XI 3.1 servers now by running this command from the serverAgent directory:
C:serverAgent>startAgent.bat
JMeterPlugins Agent version 1.3.2
No port specified, the default value is used: 4444
------ File Systems init: ------
File System detected: C:
--------------------------------
--- Network Interfaces init: ---
Network interface detected: eth0
Network interface detected: lo0
--------------------------------
Waiting for incoming connections...
You can specify an alternate port by adding a port number to the command line like this:
C:serverAgent>startAgent.bat 4445
Once the Server Agents are running you can execute your performance test like normal. I'll execute the 'Web Intelligence – Refresh and Drill' Thread Group for 50 users, with a ramp-up period of 300 seconds, and repeat it 2 times.
Once the test is complete, we'll have a nice summary for each of the metrics monitored. In this case, it looks like the CPU on the Webi Report Server machine is maxed out (look at R3SP3B indicated by the blue line)

In my next post, I'll talk about the use of a Tomcat Monitor Test Plan for examining the health and performance of a Tomcat server instance. Once that tool has been added to the arsenal, we'll review the performance metrics in depth and make a determination as to whether or not we can tune the system to meet our objective, or if additional CPU are required to meet our concurrency targets.
