- SAP Community
- Products and Technology
- Technology
- Technology Q&A
- Manual Resequencing Of Records
- Subscribe to RSS Feed
- Mark Question as New
- Mark Question as Read
- Bookmark
- Subscribe
- Printer Friendly Page
- Report Inappropriate Content
Manual Resequencing Of Records
- Subscribe to RSS Feed
- Mark Question as New
- Mark Question as Read
- Bookmark
- Subscribe
- Printer Friendly Page
- Report Inappropriate Content
on 05-02-2016 8:20 PM
In my attempt to create an income statement I have reached the point where I have added a group name to each record of data. I now have my report showing one line per group. However, it's doing a default sort of alphabetical ascending on the group name. I need to be able to customize the sequence of groups as well as add various text fields and subtotals throughout the records. Is this possible?
- SAP Managed Tags:
- SAP BusinessObjects - Web Intelligence (WebI)
Accepted Solutions (1)
Accepted Solutions (1)
- Mark as New
- Bookmark
- Subscribe
- Subscribe to RSS Feed
- Report Inappropriate Content
How many groups do you have in the report?If these are some 10 or 20 then you can do by sort in webi report.Right click Sort->Advance
For subtotal row use Break and use the subtotal.
You must be a registered user to add a comment. If you've already registered, sign in. Otherwise, register and sign in.
- Mark as New
- Bookmark
- Subscribe
- Subscribe to RSS Feed
- Report Inappropriate Content
- Mark as New
- Bookmark
- Subscribe
- Subscribe to RSS Feed
- Report Inappropriate Content
- Mark as New
- Bookmark
- Subscribe
- Subscribe to RSS Feed
- Report Inappropriate Content
- Mark as New
- Bookmark
- Subscribe
- Subscribe to RSS Feed
- Report Inappropriate Content
- Mark as New
- Bookmark
- Subscribe
- Subscribe to RSS Feed
- Report Inappropriate Content
http://www.myaccountingcourse.com/financial-statements/images/income-statement-example.jpg
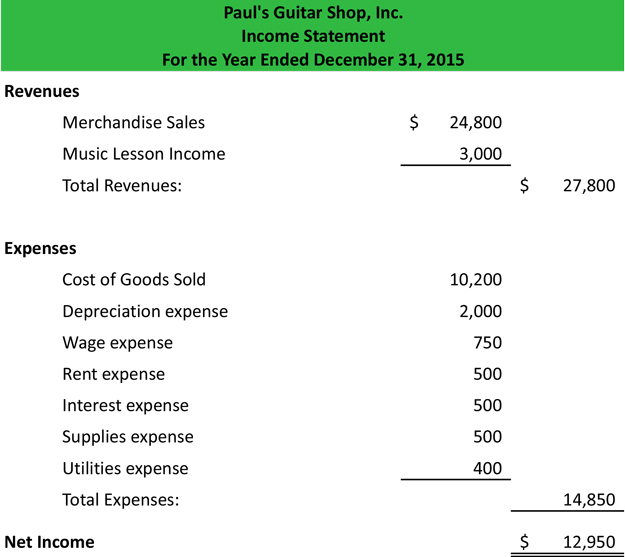
I don't think you are understanding what I am trying to do. I simply want to insert calculations between rows in the existing table. Is BusinessObjects not capable of doing that sort of design? I know that Insight does this as I've seen Income Statements designed with Insight. There are not separate tables in this design.
Here's an example of what an income statement looks like:
- Mark as New
- Bookmark
- Subscribe
- Subscribe to RSS Feed
- Report Inappropriate Content
- Mark as New
- Bookmark
- Subscribe
- Subscribe to RSS Feed
- Report Inappropriate Content
is this what was required?
[Group]= If([Query 3].[Col1] ="Sales" Or [Query 3].[Col1] ="COGS") Then "Revenue" ElseIf([Query 3].[Col1] ="Labor" Or[Query 3].[Col1] ="Admin") Then "Expenses"
and for Revenue - Expenses, use the below folrmula
=(Sum([Actual Current Period]) Where ([Group]="Expenses")) - (Sum([Actual Current Period]) Where ([Group]="Revenue"))
Hope it make sense.
- Kuldeep
- Mark as New
- Bookmark
- Subscribe
- Subscribe to RSS Feed
- Report Inappropriate Content
I understood your question.In webi you can achieve but you need to go with multiple tables and relative position to align tables. Straightforward you can't.Your attached screenshot is one example of Crystal report.
one option is to create the Hierarchy in your back-end system like your requirement and use in the report.
- Mark as New
- Bookmark
- Subscribe
- Subscribe to RSS Feed
- Report Inappropriate Content
- Mark as New
- Bookmark
- Subscribe
- Subscribe to RSS Feed
- Report Inappropriate Content
- Mark as New
- Bookmark
- Subscribe
- Subscribe to RSS Feed
- Report Inappropriate Content
- Mark as New
- Bookmark
- Subscribe
- Subscribe to RSS Feed
- Report Inappropriate Content
If I made each of these groups (Sales, COGS, etc.) the highest level of a hierarchy, with the individual accounts contained in those groups the only other members (e.g. Sales might be accounts 100 through 400, COGS might be 600 through 900, etc.) and then ran individual reports so that each result was a single row/group, how could I get the equations that I wanted, such as a field that was Sales minus COGS?
- Mark as New
- Bookmark
- Subscribe
- Subscribe to RSS Feed
- Report Inappropriate Content
- Mark as New
- Bookmark
- Subscribe
- Subscribe to RSS Feed
- Report Inappropriate Content
- Mark as New
- Bookmark
- Subscribe
- Subscribe to RSS Feed
- Report Inappropriate Content
Basically it sounds like that if my Income Statement includes 20 groups that I've defined I will have to run 20 different queries, filtering each query so that it only includes that group. Then I can manually add the various groups to a new report and add blank fields where I wish that can hold formulas doing math on the values in the various groups. Does that make sense?
- Mark as New
- Bookmark
- Subscribe
- Subscribe to RSS Feed
- Report Inappropriate Content
Hi Jeff,
Yes, it makes sense and I understand. But, it's going to kill the performance of the report when you have 20 queries in the report (I hope you don't do that), and you'll obviously have to merge dimensions on the common objects (only which are needed, not on all common objects). Merge dimensions impact the performance, so queries is going to kill the performance.
Makes sense?
Can't you create variables in the report itself for different groups without creating multiple queries? That'd be one of the preferred solutions.
@Gurus: Please chime in.
Thanks,
Mahboob Mohammed
- Mark as New
- Bookmark
- Subscribe
- Subscribe to RSS Feed
- Report Inappropriate Content
I definitely don't want to impact the performance, especially since the source table has over a million records. In addition to that I had to hide many columns just to get to the basic format of what I want the end user to see.
I would love to use variables but I'm not quite sure how to do that to get the results I need, as the numeric values shown, other than the Variance, are already variables. The first column, the groups, are assigned by the hidden account number column. This image I made using eFashion shows what I'm trying to do, though in a much simpler way. The two rows are individually placed elements but formatted to look like correct with another field added that shows the difference between the two. There would other groups below these, etc., also with subtotals. It's imperative that I be able to place these free-form fields as needed.
- Mark as New
- Bookmark
- Subscribe
- Subscribe to RSS Feed
- Report Inappropriate Content
Jeff,
Currently, I'm working for a Finance Team and have created Income Statements and P&L reports, they are usually one of the most complex reports and tricky to create too.
Some sample images what I created look like below:
- For Total Company (including all Divisions and Regions) created using a Cross Tab
- By Division: (Division show on Top in the Cross Tab)
- By Region: (Region show on Top in the Cross Tab)
The report can be created using Multiple tables or just one table, each method has pros and cons.
Multiple tables (or Cross tabs):
Create different tables for a set of Revenue Streams grouped together and one for each Sub Total. They help us to reduce the number of variables, but the filters on each tables differ on each of those tables which is not bad. But, if you look at the By Division tab snap I have here, we may see some of those tables shrink and show less Divisions if you don't have data for all possible combinations (Revenues &/or Expense for Streams 1,2,3 don't have data for Division 1 or Region 2, then the table will be shrunk and wont shoe Division 1 or Region 2 in the report).
Multiple variables:
We can do this by creating many variables, may end up creating as many variables as the number of cells in a table, each cell may be a different formula similar to excel.
What I did is:
I created multiple queries:
- Query 1 for Current Year's Data (using 2 combined queries)
- Combined Query 1: for Revenue data
- Combined Query 2: for Expense data
- Query 2 for Current Year's Data (using 2 combined queries)
- Combined Query 1: for Revenue data
- Combined Query 2: for Expense data
And used Cross tabs in the report, but had table shrinking problem, in that case, I created one variable each for all the cells in a block. Ex: Suppose there is no data for Expense for Stream 10 for Regions 2 and 3, the table would shrink and show nothing for Regions 2 and 3, so, what I did is created below variables and put them in a cross tab with as many columns and formatted to look just like the other tables.
Expense for Stream 10_MTD_Region 1
Expense for Stream 10_YTD_Region 1
Expense for Stream 10_Prior Yr MTD_Region 1
Expense for Stream 10_Prior Yr YTD_Region 1
Expense for Stream 10_MTD_Region 2
Expense for Stream 10_YTD_Region 2
Expense for Stream 10_Prior Yr MTD_Region 2
Expense for Stream 10_Prior Yr YTD_Region 2
Expense for Stream 10_MTD_Region 3
Expense for Stream 10_YTD_Region 3
Expense for Stream 10_Prior Yr MTD_Region 3
Expense for Stream 10_Prior Yr YTD_Region 3
Makes sense?
How many queries do you currently have without even thinking about those 20 queries (which you'll never add)? What are the different queries used for?
Thanks,
Mahboob Mohammed
- Mark as New
- Bookmark
- Subscribe
- Subscribe to RSS Feed
- Report Inappropriate Content
- Mark as New
- Bookmark
- Subscribe
- Subscribe to RSS Feed
- Report Inappropriate Content
Hi Jeff,
Try to create another group on top of the existing group.
Group2=If (Group1 inlist ("Sales";"COGS") ; "Revenue" ;if(Group1 inlist("Admin";"Labor");"G2"))....etc
Add this new group to your table and then apply break on this new group. Then delete the row between the each blocks formed by breaks. So you get single table.
In the footer row you can put the formula that is needed.
In my example Group1 is country and group2 is continent. The bold text is the break footer
Continent | country |
G1 | India |
G1 | 1 |
country | |
G2 | Philipp |
Singapore | |
G2 | 2 |
- Mark as New
- Bookmark
- Subscribe
- Subscribe to RSS Feed
- Report Inappropriate Content
Hi Jeff,
Please follow Divya's suggestion, that is one of the best ways to do it, which I forgot to mention last time. The only thing I don't about that way is, whether you'll have table shrinking problem/issue, if you're using multiple Crosstabs/Tables and if there is no data for a certain combination of values from different objects.
Thanks,
Mahboob Mohammed
- Mark as New
- Bookmark
- Subscribe
- Subscribe to RSS Feed
- Report Inappropriate Content
This looks like something I might want to try but I'm not sure where to create the new groups based on existing groups. For example, if I want to create a new group called Revenue and have that group contain groups Sales and Cost of Goods Sold where do I define Revenue? If I right click on the existing group column Sales I can only work with the existing groups. It doesn't seem to let me create a new group. If I insert a new column to the left of my existing group column I can't seem to create new groups in that column, either.
- Mark as New
- Bookmark
- Subscribe
- Subscribe to RSS Feed
- Report Inappropriate Content
Hi Jeff,
What we meant by creating new group is create a variable as mentioned in previous step
Group2=If (Group1 inlist ("Sales";"COGS") ; "Revenue" ;if(Group1 inlist("Admin";"Labor");"G2"))....etc
Add this variable to your table and then apply break and add the calculations at the footer level.
Then hide this variable by right clicking this new column
- Mark as New
- Bookmark
- Subscribe
- Subscribe to RSS Feed
- Report Inappropriate Content
- Mark as New
- Bookmark
- Subscribe
- Subscribe to RSS Feed
- Report Inappropriate Content
- Mark as New
- Bookmark
- Subscribe
- Subscribe to RSS Feed
- Report Inappropriate Content
- Mark as New
- Bookmark
- Subscribe
- Subscribe to RSS Feed
- Report Inappropriate Content
- Mark as New
- Bookmark
- Subscribe
- Subscribe to RSS Feed
- Report Inappropriate Content
- Mark as New
- Bookmark
- Subscribe
- Subscribe to RSS Feed
- Report Inappropriate Content
- Mark as New
- Bookmark
- Subscribe
- Subscribe to RSS Feed
- Report Inappropriate Content
- Mark as New
- Bookmark
- Subscribe
- Subscribe to RSS Feed
- Report Inappropriate Content
- Mark as New
- Bookmark
- Subscribe
- Subscribe to RSS Feed
- Report Inappropriate Content
- Mark as New
- Bookmark
- Subscribe
- Subscribe to RSS Feed
- Report Inappropriate Content
Hi Jeff,
Do you want to get rid of all the grid lines? No matter which row and column it is, e.g. header row, data rows, break footer Summary row, Grand Summary row?
Go back to the Structure mode, hold CTRL and select all the cells one by one (while holding CTRL), then right click and select Format Cell -> Border -> click that No Border icon (just below the icon that has black borders -> click Apply and OK.
Voila.
Thanks,
Mahboob Mohammed
- Mark as New
- Bookmark
- Subscribe
- Subscribe to RSS Feed
- Report Inappropriate Content
- Mark as New
- Bookmark
- Subscribe
- Subscribe to RSS Feed
- Report Inappropriate Content
Answers (1)
Answers (1)
- Mark as New
- Bookmark
- Subscribe
- Subscribe to RSS Feed
- Report Inappropriate Content
You must be a registered user to add a comment. If you've already registered, sign in. Otherwise, register and sign in.
- Mark as New
- Bookmark
- Subscribe
- Subscribe to RSS Feed
- Report Inappropriate Content
- SAP Analytics Cloud - Performance statistics in Technology Blogs by SAP
- Data Proposal for Sales Order Requests - Determination with Reference to Order Creation History in Technology Blogs by SAP
- SAP Build - create Full-Stack application CAP+FIORI by using Joule. in Technology Blogs by Members
- Activating Embedded AI – Intelligent GRIR Reconciliation in Technology Blogs by SAP
- SAP Datasphere - Space, Data Integration, and Data Modeling Best Practices in Technology Blogs by SAP
| User | Count |
|---|---|
| 95 | |
| 11 | |
| 10 | |
| 9 | |
| 9 | |
| 7 | |
| 6 | |
| 5 | |
| 5 | |
| 4 |
You must be a registered user to add a comment. If you've already registered, sign in. Otherwise, register and sign in.